

In my recent articles and “Shimmy Says” videos, I introduced the Futurum Signal reports and outlined how they represent a fresh direction for technology market analysis. Today, I’m following up to explain what you’ll actually find in the Signal Data Intelligence Platforms report—and why it’s worth your attention if you want timely, actionable insight about the data intelligence landscape.
Why a New Approach?
Traditional analyst reports often arrive months after the fact, describing trends from last year — or even older. In a market transformed by AI and rapid innovation, that lag just doesn’t cut it anymore. Signal, by contrast, is designed to provide a forward-looking, visual summary that’s easy to interpret and immediately useful.
As the saying goes, “A picture is worth a thousand words — and the full report is priceless.”
What’s Inside the Signal Report?
The Signal Data Intelligence Platforms report is structured to help you quickly understand who’s moving the market, who’s innovating and which vendors are future-proofing their offerings.
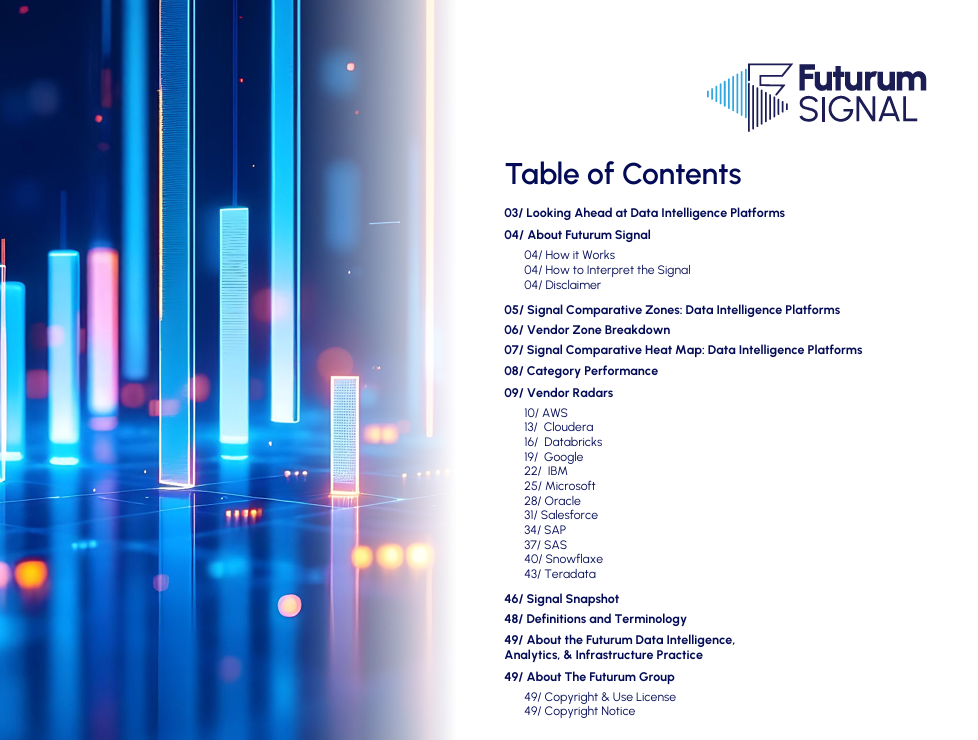
Key Sections & Graphics (with Page Numbers):
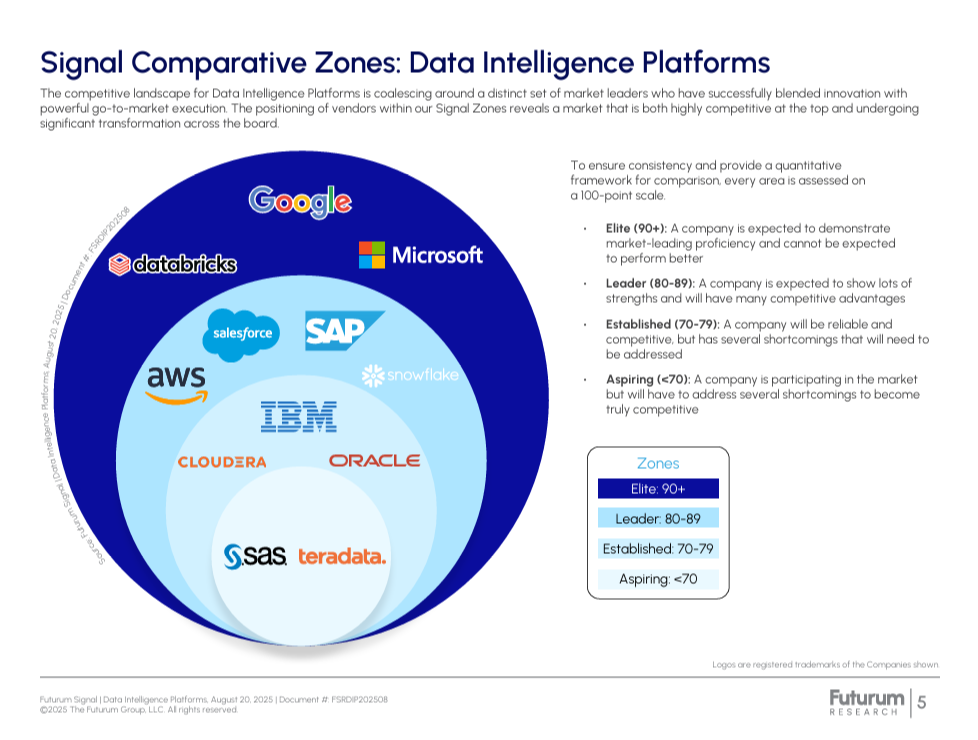
Comparative Zones: A high-level map of the Data Intelligence Platform market.
See: “Signal Comparative Zones: Data Intelligence Platforms” (Page 5)
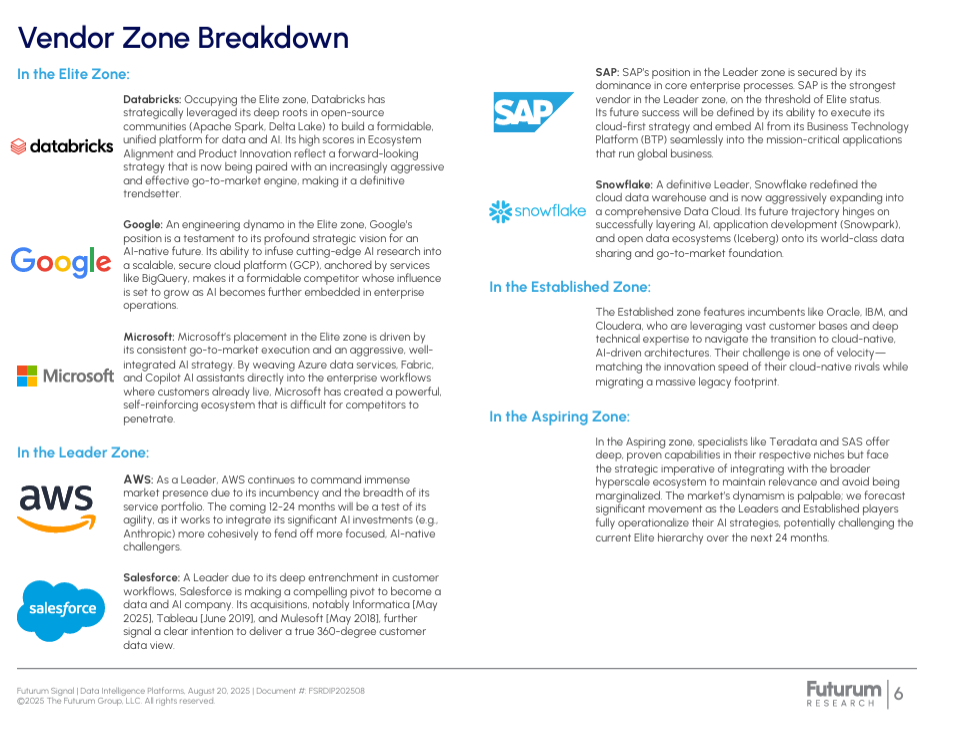
Vendor Zone Breakdown: Detailed breakdown showing how each major platform vendor slots into the performance and innovation landscape.
See: “Vendor Zone Breakdown” (Page 6)
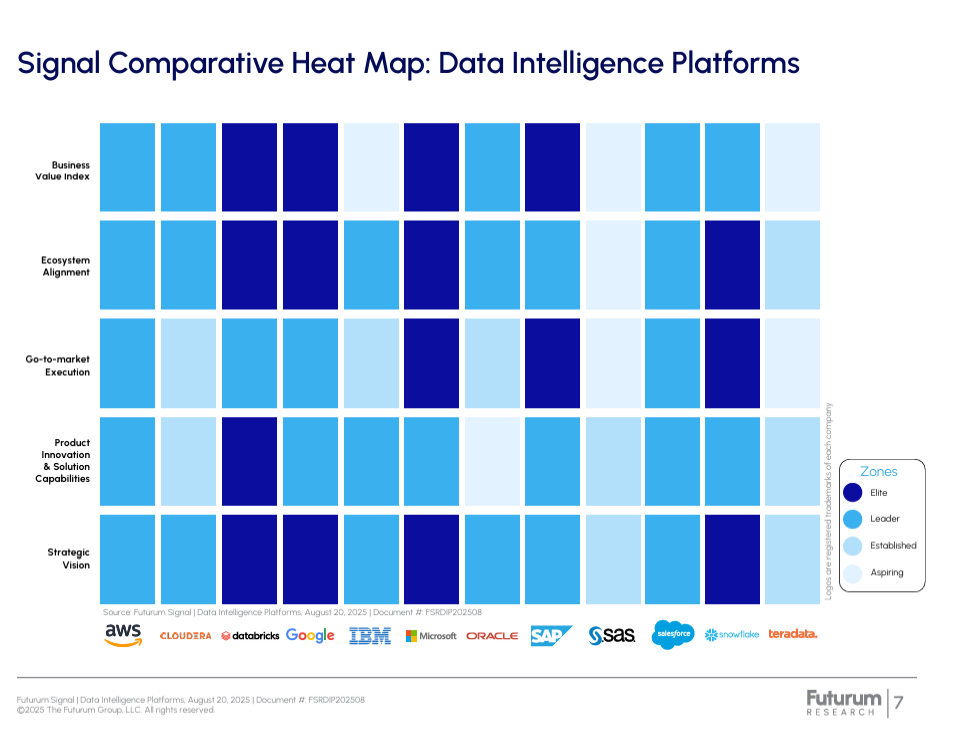
Comparative Heat Map: Visualizes the relative strengths, weaknesses and differentiators among the vendors.
See: “Signal Comparative Heat Map: Data Intelligence Platforms” (Page 7)
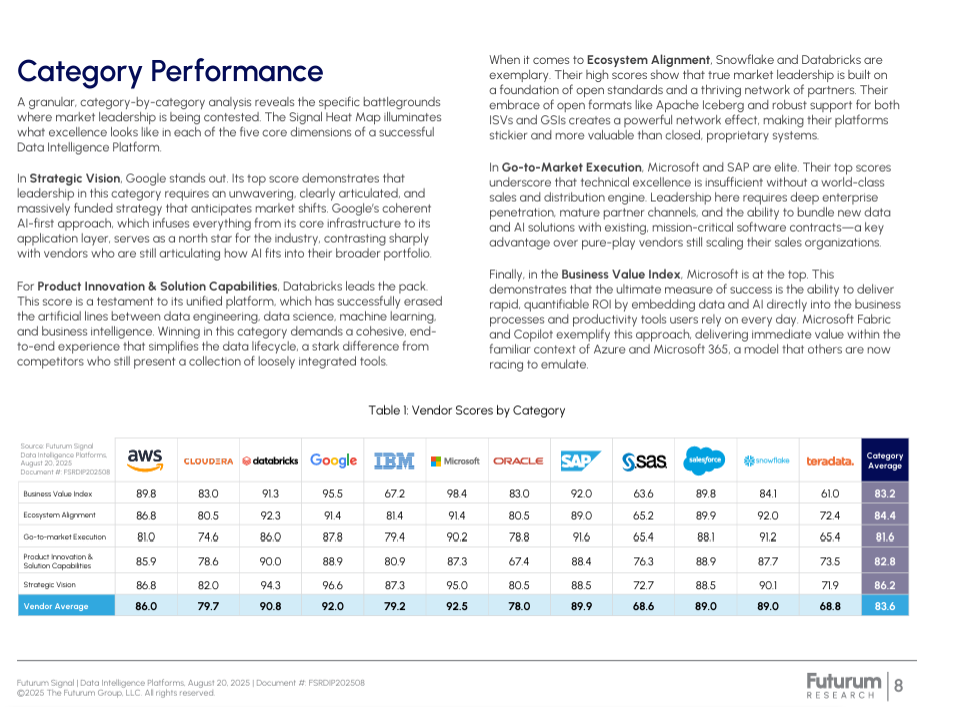
Category Performance: Evaluates platforms on key capabilities — like AI enablement, integration, scalability and market momentum.
See: “Category Performance” (Page 8)
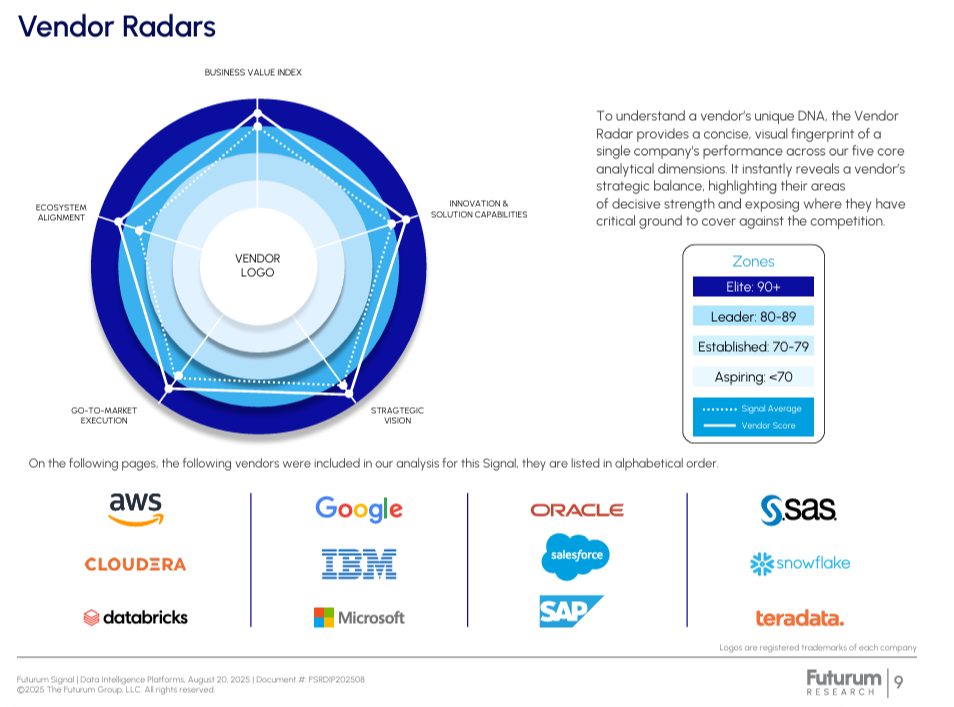
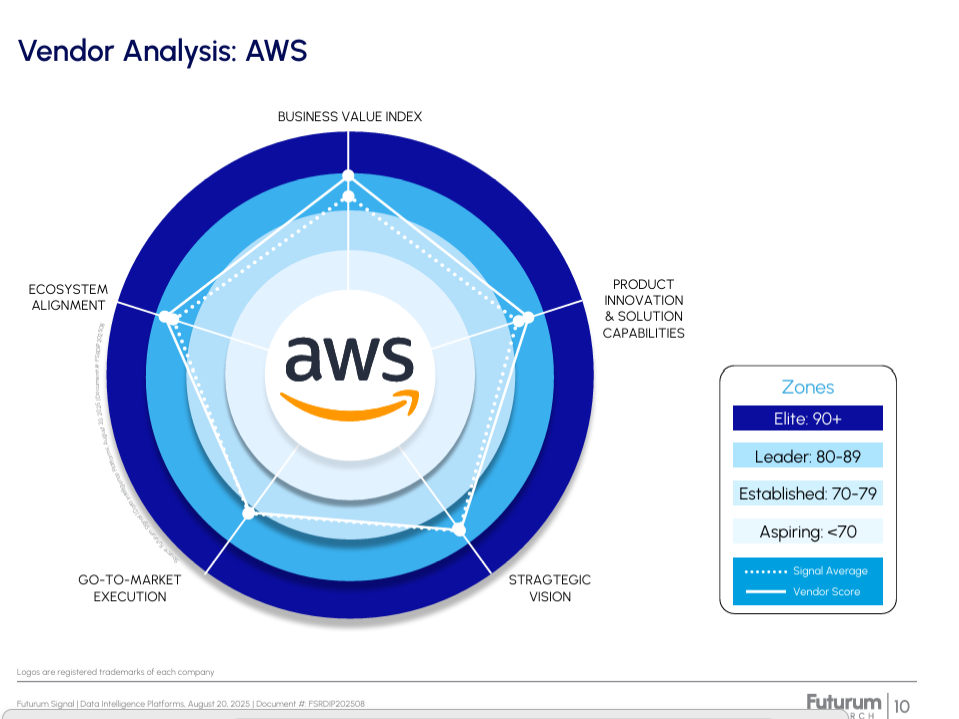
Vendor Radars: Individualized analysis and visual radar charts that highlight each vendor’s positioning across multiple criteria.
See: “Vendor Radars” (Page 9), with detailed vendor breakouts on pages 10–45 (e.g., AWS p.10, Cloudera p.13, Databricks p.16, and so on through Teradata p.43)
Signal Snapshot: A concise, at-a-glance summary of the report’s top-level findings and recommendations.
See: “Signal Snapshot” (Page 46)
Download, Explore and Decide for Yourself
The beauty of the Signal report is that you don’t have to take my word for it. You can download it for yourself and dig into the details, the graphics, and the comparative analysis.
Why I’m Excited About Signal
As I mentioned last week on Shimmy Says, it’s easy to be skeptical about reports that look backward rather than forward — especially when the pace of change is this fast. The Signal report stands out for its:
– Clear, up-to-date mapping of vendor innovation and momentum
– Visual, easy-to-digest format (no wading through 100 pages for one good chart)
– Attention to a diverse and evolving set of vendors — not just the legacy giants, but also emerging challengers who will likely shape next year’s landscape
Note the “Companies Under Consideration” section at the end of the report, which previews additional vendors and platforms being tracked for future versions. The goal is to ensure the Signal report reflects a market that’s constantly shifting, not a fixed snapshot frozen in time.
Bottom Line
Signal isn’t meant to be the final word, but it is a strong signal — helping buyers, strategists and tech leaders cut through the noise and focus on momentum, not just market share. If you’re making big bets on your data intelligence stack, you’ll want the clearest view possible.
Again, I encourage you to download the full report here — and let me know what you think.