
TL;DR — Key Takeaways
- Cloud storage incidents often span applications, databases, Kubernetes and infrastructure changes.
- AI cannot perform reliable root-cause analysis when telemetry remains isolated across separate dashboards.
- Evidence graphs connect traces, metrics, logs, events, identities and deployment changes into a defensible causal chain.
- AI should receive a limited investigation package rather than unrestricted access to cloud environments.
- Assistants can summarize evidence, rank hypotheses and recommend approved runbooks.
- High-impact actions should remain governed by deterministic checks and human approval.
- Teams should begin with one recurring storage failure pattern and measure whether AI improves diagnosis speed and safety.
Cloud storage incidents rarely begin and end in storage. AI can accelerate diagnosis, but only when it connects application behavior, database state, Kubernetes changes and cloud storage evidence.
A cloud-native checkout service slows down. Application latency rises. Database commits become erratic. One dashboard shows elevated I/O wait, another shows a pod restart and a third shows a recent volume attach event. Every panel may be accurate, yet none tells the complete story.
This is the weakness in much of today’s AI-for-observability approach. A chat interface layered over disconnected cloud dashboards does not create root-cause analysis. It may summarize symptoms elegantly while missing the infrastructure change that caused them.
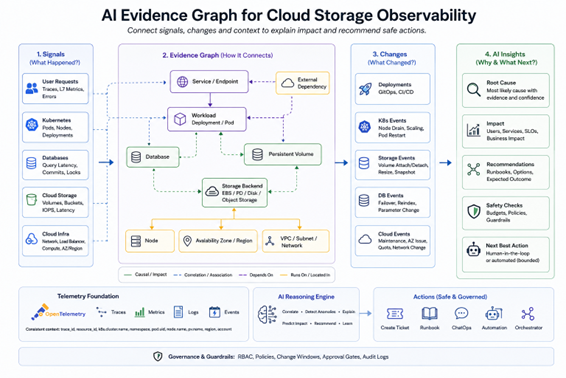
For enterprise cloud storage, the better AI-first approach is an evidence graph: A connected operational view of customer requests, Kubernetes workloads, database operations, cloud storage resources and infrastructure changes.
Cloud Storage Incidents Cross Too Many Boundaries
A storage incident may begin with an application release, a database failover, a node drain, a noisy neighbor, a replication lag, a network-path issue or a cloud storage bottleneck. Kubernetes adds another layer of complexity: Pods are short-lived, operators reconcile resources in the background and persistent volumes may remain healthy while a workload is slow or repeatedly recovering.
Cloud storage capacity, IOPS and latency dashboards are necessary but insufficient. They show that a resource is under pressure. They do not reliably establish whether that resource is the cause, the victim or simply adjacent to the incident. AI should not be asked to guess the difference.
Dashboards Show Signals, Evidence Graphs Show Causality
A cloud monitoring dashboard answers, “What is this metric doing?” An incident responder needs the harder answer: “What changed, what did it affect and what evidence supports that conclusion?”
OpenTelemetry is a useful foundation because traces, metrics and logs can carry shared resource context. Enrich signals with cloud and Kubernetes identity, such as region, cluster, namespace, workload, pod, node and persistent-volume identifiers. Ingest selected cloud, Kubernetes and operator events as structured data, then attach change identifiers from GitOps or CI/CD.
Names help people, but names are reused. Prefer stable workload, pod and volume identifiers for correlation, then preserve the cloud region and the time window in which the relationship existed.
Give AI an Investigation Package, not Unlimited Cloud Access
When a cloud storage SLO breaches, the assistant should receive a constrained evidence package:
- The affected cloud service, route, SLO and incident window
- Representative traces that crossed the latency threshold
- Workload, pod, node, database and storage identities from those traces
- Relevant volume, CSI, cloud and operator events
- Recent deployments, scaling, failovers or maintenance changes
- Approved runbooks and policy boundaries for proposed actions
This turns “Find the root cause” into a defensible task: Explain which evidence supports or contradicts each likely hypothesis. A cloud node upgrade, for example, becomes credible only when it aligns with volume attachments, database recovery activity and customer-facing latency. The assistant should show that chain, identify uncertainty and state what would disprove it.
Keep AI Outside the Cloud Safety Loop
AI can summarize evidence, rank hypotheses, draft incident updates and recommend runbooks. It should not independently fail over a cloud database, cordon a node or resize production cloud storage.
Use staged autonomy:
- Observe: Produce an evidence-backed incident brief.
- Recommend: Propose approved cloud runbooks and the expected blast radius.
- Bounded Action: Execute only reversible, pre-approved actions after deterministic checks.
- Governed Action: Require explicit approval for high-impact cloud changes.
The safety checks must remain deterministic. Is this production? Is the error budget exhausted? Does the action violate a disruption budget? Is backup status current? Is the command in an approved runbook? The agent can propose. The cloud platform must decide.
Start With One Cloud Storage Failure Pattern
Do not model the entire cloud estate first. Pick one recurring failure pattern: Database write latency after node maintenance, PVC mount delays during autoscaling or replication lag after a topology change.
The success metric is not how fluent the AI explanation sounds. It is whether the system surfaces the right cloud evidence faster, eliminates bad hypotheses earlier and recommends only actions the platform can safely permit.
AI-first cloud observability is not about giving a model more dashboards. It is about giving cloud engineers a trustworthy chain of evidence. Before adding another observability copilot, ask: “Can your cloud platform prove why the AI believes a storage action is safe?”